What we do
1. What we make
SAMRoute produces quantitative risk indicators that describe the nearby environment of European rail infrastructure assets — what surrounds the track, the crossing, or the structure. The platform brings the surrounding context into one analytical view, on the same reference, across the whole portfolio. Owners are the experts on the assets themselves; SAMRoute reads the territory around them.
Infrastructure managers' asset-management teams use the output as a portfolio-wide ranking against shared metrics. Reinsurers' portfolio analysts use it as an independent reading of the asset base they are exposed to.
Indicators are reproducible: same inputs, same outputs. Every per-asset score unfolds back to the layers, assumptions, and reference materials that produced it.
2. The current line of work
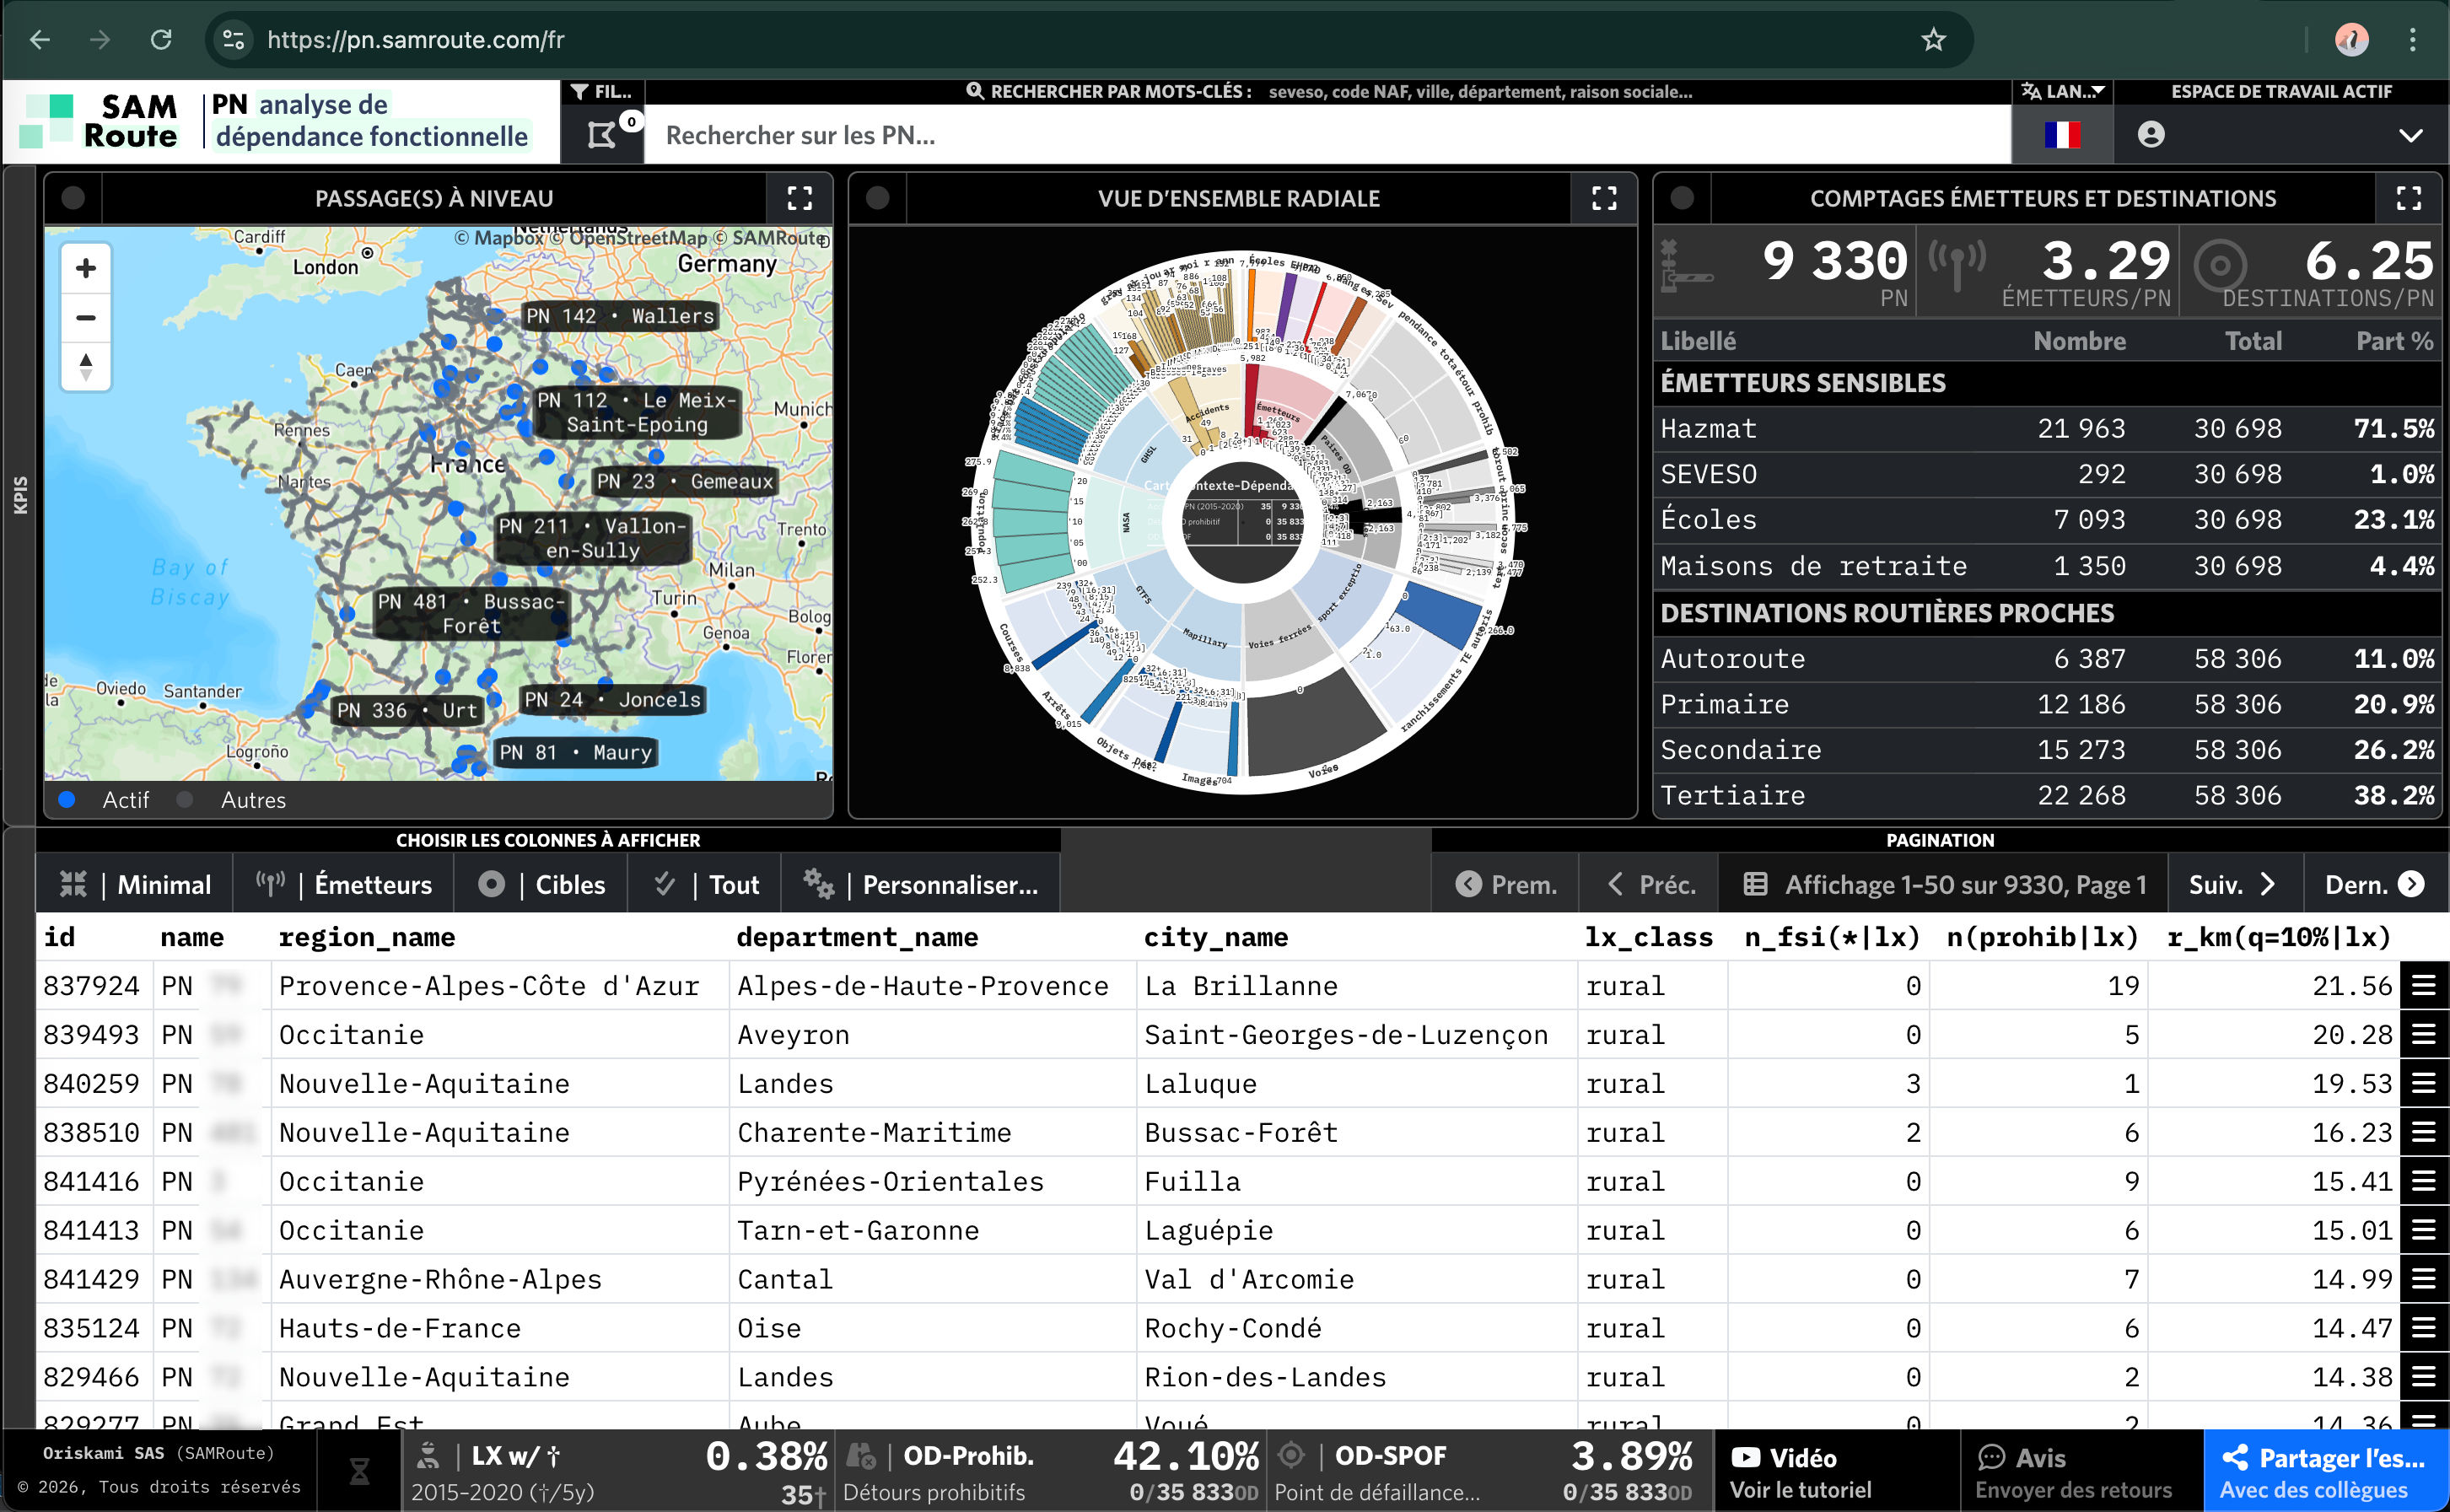
The current production line is the characterisation of road–rail level crossings. It covers every active level crossing on the French national network, with roughly 200 metrics per crossing describing the immediate environment. Reference materials include the CEREMA inspection grid for category-2 and category-3 crossings and the EPSF technical referential.
The first end-to-end production delivery was made to SNCF Réseau in November 2025 and validated against field data in December. The year-by-year build-up is on the Research timeline.
3. What the customer sees
The output is exposed in two complementary views. A portfolio view supports filtering and ranking across the whole network: the analyst sorts by indicator value, by risk family, by geographical zone, or by combinations.
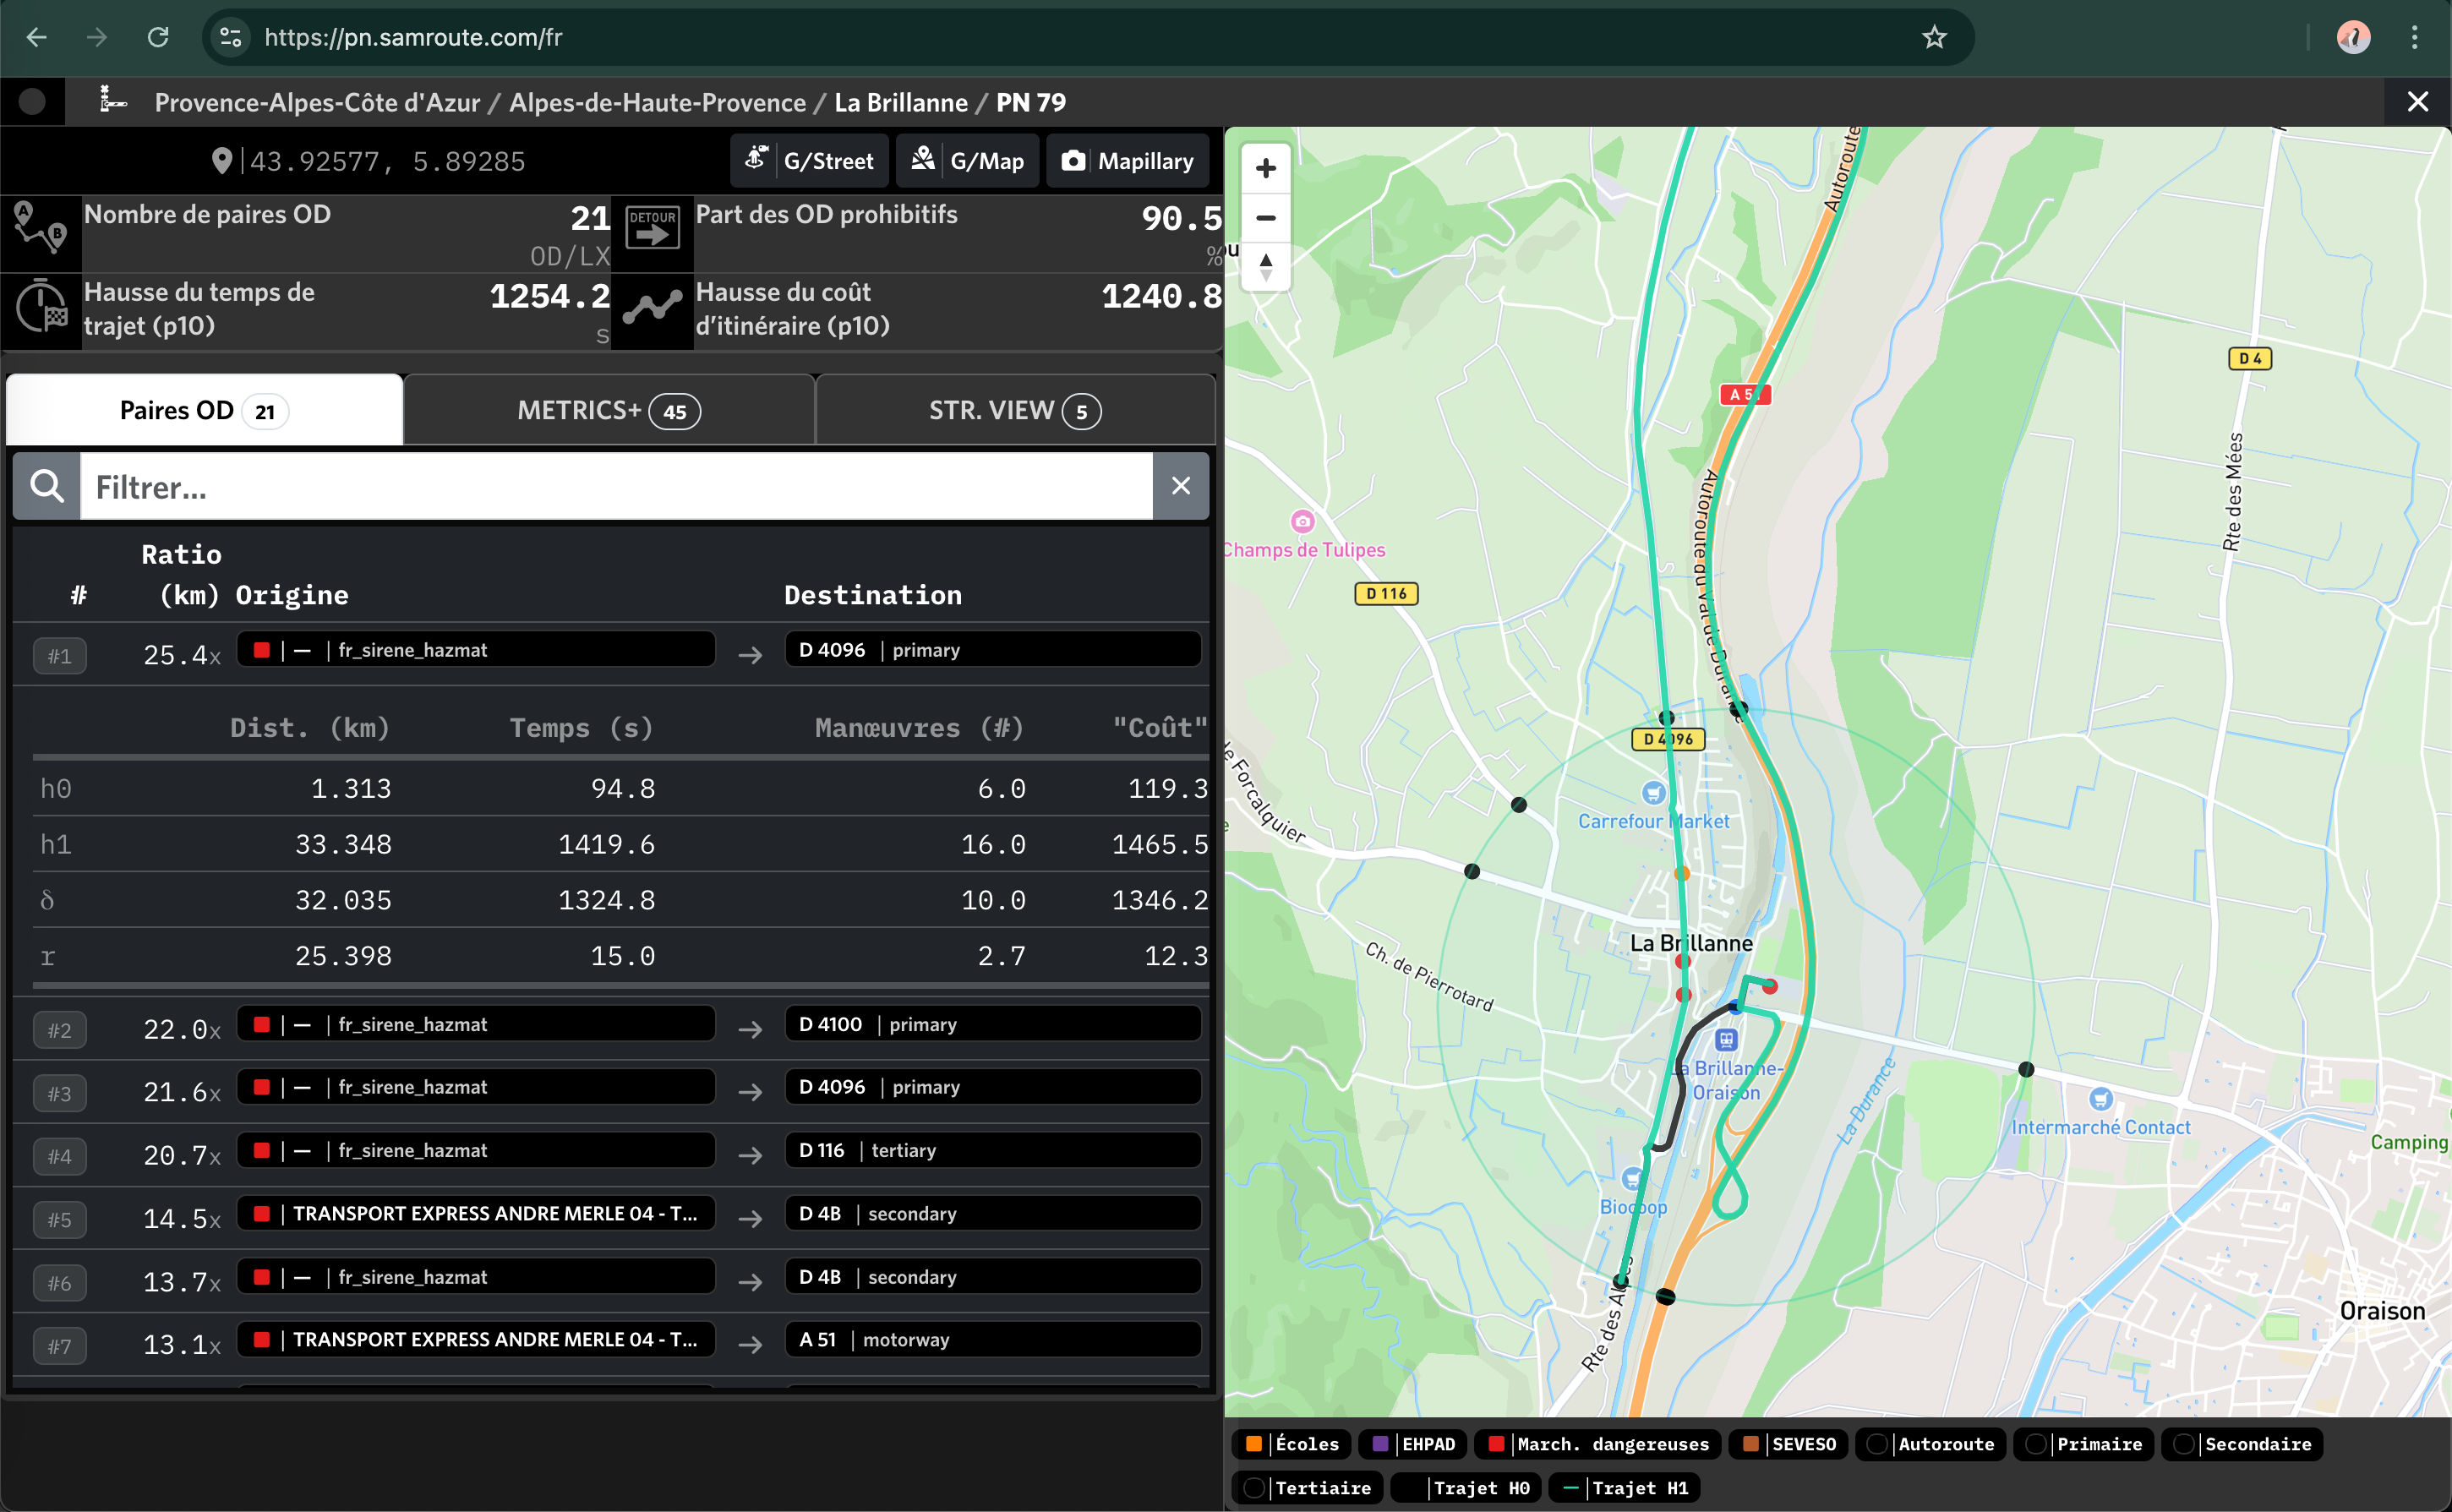
A per-crossing view exposes the underlying origin–destination pair metrics for any individual crossing, including the cost ratio that quantifies how strongly the surrounding flow depends on it. Both views render in the browser and export cleanly into internal asset-management and resilience reports.
4. How it integrates
The platform ingests open and sovereign geospatial layers (NASA GPW, ESA Copernicus GHSL and Worldcover, IGN RGE Alti, Eurostat, OpenStreetMap, Mapillary, ONISR, SIRENE, GTFS), enriches them with reference taxonomies, runs the analytical pipeline, and exposes results through web views and a documented API.
Customer data exports run in standard machine-readable formats (CSV, JSON, geo-package) at any time during the subscription. EU-only data residency, sub-processor list, retention policy, and DPA availability sit on the Trust & Security page.
The reference dataset can be initiated from the open and sovereign sources alone. Internal customer feeds integrate later, when they add value.
5. Scope today
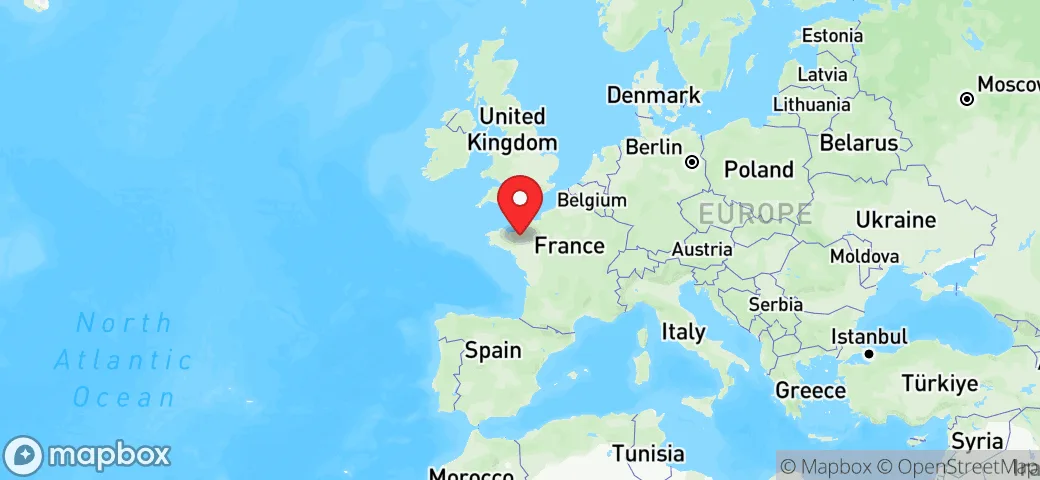
The production scope today is the French national rail network for the level-crossing line of work. Initial datasets have been tested for Spain. Extension to other European networks is paced by data-availability discussions with each relevant infrastructure manager.
Adjacent nearby-environment scopes — embankment context, drainage corridors, station-approach surroundings — sit on the research substrate. Production-readiness is paced by customer demand and data availability.
The platform occupies the decision-support and resilience-analysis layer of the rail-IT stack. It complements the methods, audits, and local studies owners already run on their own assets, and works alongside the operational systems (real-time traffic management, control-command, ITS) that run the network in the moment.
Every per-asset score remains auditable: data sources, versions, assumptions, and computation steps are documented and unfoldable on demand.
6. Reach us
Commercial enquiries, methodology questions, technical due diligence: contact@samroute.com or +33 2 30 96 66 74. We route them to the right person.